
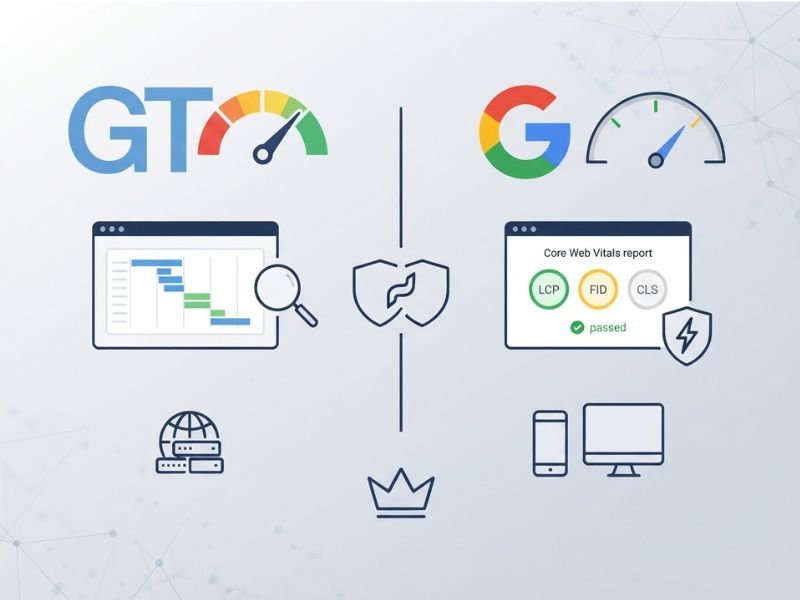
Comparing GTmetrix vs PageSpeed Insights usually leads to the question of which score to consider when the same site receives different results in the tools. What do you believe in? Use PageSpeed Insights (PSI) first to receive instant feedback along with real-user data, and GTmetrix later to dig deeper and get request-level analytics, along with better test configuration options.
The comparison of GTmetrix vs PageSpeed Insights cannot be considered as determining the best option among them. In the tools, you might have different configurations, such as different browsers, locations, network conditions, etc. It makes both the results valid. This guide will explain what the results mean, why the scores are different, how Core Web Vitals affect SEO, etc.
GTmetrix vs PageSpeed Insights at a Glance
The easiest way to understand GTmetrix vs PageSpeed Insights is to compare what each tool is designed to show.
| Feature | GTmetrix | PageSpeed Insights |
| Main purpose | Detailed website performance testing and diagnostics | Quick performance assessment and optimization guidance |
| Lighthouse lab testing | Yes | Yes |
| CrUX field data | Yes | Yes |
| Mobile testing | Yes, with available configuration options | Yes |
| Desktop testing | Yes | Yes |
| Test controls | More configurable, depending on plan | More standardized |
| Waterfall diagnostics | Yes | No traditional Waterfall chart |
| Historical monitoring | Available, with plan-dependent limits | Not designed as a monitoring platform |
| Free access | Free testing with feature limits | Free |
| Best fit | Developers, marketers, and owners needing deeper diagnostics | Quick checks and Google’s real-user context |
Both tools can provide data in a lab or field setting. The present comparison made by GTmetrix highlights that both tools have this feature in common.
PSI comes handy for a quick and free spot check. For analyzing a slow request, a problematic render blocking resource, or page loading process, GTmetrix provides more detailed diagnostics views. Some of the GTmetrix monitoring and testing tools and advanced configurations are dependent on the plan you choose.
To summarize, GTmetrix vs PageSpeed Insights should be used in conjunction rather than in a head-to-head score comparison.
How GTmetrix and PageSpeed Insights Measure Performance
It is important to understand the testing process before analyzing GTmetrix vs PageSpeed Insights scores.
Lighthouse and lab testing
The tools employ lab testing that uses Lighthouse technology; however, they have some different approaches.
During lab testing, a page is tested in a predetermined environment. The tool navigates to the URL, monitors browser actions, collects performance data, and analyzes the result. Thus, lab testing is helpful when you are working on optimizing your site because you can conduct another lab test after you implement some changes.
Nonetheless, lab test only reflects a certain testing environment and does not show the experience of all visitors to your site.
CrUX and real-user field data
Field data is based on actual Chrome users via Chrome User Experience Report, or CrUX. This type of data reflects the real user experience rather than a single test done at a certain point in time.
PSI reports CrUX data over a 28-day rolling period of data collection. Field data is available on the URL level if there are enough samples for analysis. However, if there are not enough samples for a particular page, then PSI will use origin-level data. Some very low traffic or recently launched pages might not have any field data at all.
GTmetrix also provides field data via CrUX reporting options. Consequently, GTmetrix vs PageSpeed Insights comparison cannot be considered “field data vs lab data” comparison.
Performance scores versus Core Web Vitals
There is a distinction between a Lighthouse Performance score and Core Web Vitals analysis.
Lab Score of Lighthouse is derived from several Performance Scores. The Core Web Vitals concern with three User Experience Metrics which are LCP, INP and CLS.
It is important since a website can have a great Lighthouse score while having bad User Experience Metrics with regards to the Core Web Vitals. And vice versa.
This is the key difference between GTmetrix and PageSpeed Insights. Do not ever think that all the numbers are the same metric.
Why Are GTmetrix and PageSpeed Insights Scores Different?
A difference in scores doesn’t necessarily imply a broken tool. There might be differences in GTmetrix versus PageSpeed Insights scores since the tools might have tested the same page in different ways.
1. Mobile versus desktop configurations
A desktop computer usually has more processing power and a different screen size than a mobile device. PSI provides separate mobile and desktop testing, while GTmetrix also supports mobile and desktop testing with available configuration controls.
A page that performs well on desktop can therefore produce a weaker mobile result.
2. CPU and network throttling
CPU throttling makes a browser behave more like a less powerful device. Network throttling simulates slower connection conditions.
PSI applies its own testing methodology and simulated conditions. GTmetrix can use configurable testing options depending on the report and account setup.
If JavaScript takes significant processing time, different CPU conditions can change metrics such as Total Blocking Time.
3. Test location, server response, and CDN behavior
The physical location of a test server affects latency. A visitor in California may experience a different response time from a server than a visitor in New York or another country.
CDNs can also serve content from different edge locations. Server load, DNS performance, caching, and third-party resources can further change the result.
4. Browser and Lighthouse versions
These tools both run Lighthouse, but that does not mean they follow the entire process of tests the same way. Browser version, Lighthouse version, screen sizes, and the approach used to measure could have an effect on the results.
GTmetrix’s current methodology documentation specifically identifies implementation, hardware, test location, connection speed, and browser differences as reasons scores can vary.
5. Cache, third-party scripts, and normal variation
Ads, analytics tools, chat widgets, social embeds, consent platforms, and other third-party scripts can behave differently from one test to another.
Server response times can also fluctuate. Because of this, repeating a test once and treating that single score as absolute can lead to the wrong conclusion.
| Symptom | First check |
| Strong GTmetrix result, weak PSI mobile result | Device, CPU, network, and test configuration |
| Different results across repeated tests | Cache, server variability, ads, and third-party scripts |
| Good lab result, poor field result | Real-user conditions and the historical data window |
When comparing GTmetrix vs PageSpeed Insights, compare the individual metrics and testing conditions first. Do not simply ask which score is higher.
Same Website, Different Results: A BitCodeSolution Example
A useful comparison should show readers how to test the same website without selecting whichever score looks better.
For a BitCodeSolution example, the correct approach is to select one public URL and record the testing conditions before collecting results. The important point is transparency: GTmetrix vs PageSpeed Insights should not be presented with invented numbers.
For publication, record:
- Exact URL tested
- Test date and time
- Mobile or desktop device
- GTmetrix test location
- Connection settings
- PSI mobile or desktop mode
- Lighthouse version shown by each report
- Three or more runs for each comparable configuration
- Median and range for each metric
A results table should look like this:
| Metric | GTmetrix | PSI | What to examine |
| Performance score | Record actual median | Record actual median | Lab scoring differences |
| LCP | Record actual median | Record actual median | Main loading element |
| CLS | Record actual median | Record actual median | Layout movement |
| TBT | Record actual median | Record actual median | Lab responsiveness diagnosis |
| INP | Field data if available | Field data if available | Real-user responsiveness |
The important comparison is not simply “GTmetrix scored 90 and PSI scored 70.” Instead, ask why.
For example, if PSI reports weaker mobile loading while GTmetrix shows a stronger result, first compare device and throttling assumptions. If both reports identify a large hero image, that provides a stronger optimization direction.
If there is any optimization done such as compressing the main image, deferring non-essential JS, or allocating space for an image, re-run the same URL with similar settings.
This helps in getting a controlled test instead of cherry-picking successful optimization cases.
Google PageSpeed Insights vs GTmetrix: Which is Important for SEO?
For SEO, Google PageSpeed Insights vs GTmetrix should not be reduced to “which score does Google use?”
Core Web Vitals versus performance scores
Google’s current Core Web Vitals are:
| Metric | Measures | Good threshold |
| LCP | Loading performance | ≤ 2.5 seconds |
| INP | Interaction responsiveness | ≤ 200 ms |
| CLS | Visual stability | ≤ 0.1 |
Google evaluates Core Web Vitals using field data, with the assessment based on the 75th percentile when sufficient data is available.
TBT is useful for diagnosing responsiveness problems in lab testing, but it is not the same metric as INP. A low TBT does not automatically mean real users have a good INP.
Which measurements should you prioritize?
When considering Google PageSpeed Insights vs GTmetrix, prioritize evidence that helps answer the actual performance problem.
Use field data to understand how real users are experiencing the page. Use lab data to reproduce and diagnose problems. Then inspect the underlying requests and browser work to identify what needs to change.
It has been proven by Google that the Core Web Vitals are used as part of their ranking systems, but having good Core Web Vitals or a good score with the tool does not necessarily mean getting the best rankings from Google.
PageSpeed Insights vs. GTmetrix – Which One Should You Go for?
The actual answer will always depend on your purpose.
| Your goal | Useful choice |
| Free, quick assessment | PageSpeed Insights |
| Review available real-user performance | PSI or GTmetrix CrUX data |
| Investigate slow requests | GTmetrix |
| Review a loading sequence visually | GTmetrix |
| Configurable recurring testing | GTmetrix, subject to plan |
| Long-term optimization work | Use both |
PSI’s main limitation is that it provides less control over the testing environment and does not provide the same request-level Waterfall diagnostics.
GTmetrix’s limitation is that some advanced monitoring and testing capabilities depend on the account plan.
So, PageSpeed Insights vs GTmetrix is best answered according to the job. If you need a fast Google-oriented health check, PSI is a practical starting point. If you need to investigate why a page is slow, GTmetrix can provide deeper diagnostic evidence.
How to Use Both Tools to Improve Website Speed
A simple workflow can make GTmetrix vs PageSpeed Insights much more useful.
- Run PSI first. Separate the field assessment from the lab diagnostics.
- Identify the important failing metric. Focus on LCP, INP, or CLS rather than chasing the overall score.
- Run the same URL through GTmetrix. Keep the test configuration consistent between repeat tests.
- Inspect the underlying problem. Use request-level and rendering information to find the likely bottleneck.
- Make one focused change. Avoid changing ten things at once.
- Retest under comparable conditions. Compare the median or repeated results instead of one unusually good run.
- Track field performance over time. Field data represents a historical period, so it will not immediately change the moment you deploy an optimization.
The fix should match the evidence. An image-related LCP problem may require better image sizing or delivery. Heavy JavaScript can contribute to responsiveness problems. Missing dimensions for images or other elements can contribute to layout shifts.
The goal is not a perfect score. The goal is a faster, more stable page for real visitors.
GTmetrix vs PageSpeed Insights vs WebPageTest
In the debate between GTmetrix vs PageSpeed Insights vs WebPageTest, there is one tool that is helpful when the other two have left an important technical question unanswered.
| Tool | Best use |
| PageSpeed Insights | Quick assessment and available CrUX context |
| GTmetrix | Detailed diagnostics, Waterfall analysis, and monitoring options |
| WebPageTest | Additional loading-behavior and request-level investigation |
WebPageTest allows for customizable testing in various browsers, geographical locations, devices, and network settings, including timing details.
Not all tools need to be used for each page. Add the third testing only when you have an unanswered question – it could be related to latency, some request, browser, or even regional issue.
Therefore, GTmetrix vs PageSpeed Insights vs WebPageTest becomes a diagnostic process, not a competition of ratings.
Frequently Asked Questions
1. Is GTmetrix more accurate than PageSpeed Insights?
It all depends on what is being measured and the circumstances under which the test is conducted. GTmetrix and PageSpeed Insights may give different results due to differences in configuration and methodology. None of the two lab reports should be considered an accurate measure of every user’s experience.
2. Why does GTmetrix show a good grade while PSI shows a low score?
The calculations of GTmetrix and the PSI performance are done differently. It can be due to device configuration, throttling, browser settings, location, and use of Lighthouse. You should compare the actual metrics first before making any changes.
3. Can I pass Core Web Vitals with a low Lighthouse score?
Absolutely. Scoring via lighthouse lab testing and Core Web Vitals evaluation via the field are two different things. It is possible that the page will be scored poorly on lighthouse lab test but at the same time will pass the field Core Web Vitals threshold.
4. Why does PageSpeed Insights show no real-user data?
CrUX data is required to be sufficient for the given URL or origin by PSI. Pages that are new or have too few visits will not have adequate data. In some cases, PSI will give origin-level data rather than URL-level data.
5. Do I need a 100 PageSpeed score to rank well?
No. The Lighthouse score does not have to be perfect in order for Google to rank that particular page. Core Web Vitals are important, but there are other ranking factors as well that Google takes into account when ranking pages. The key thing is to work on a useful page and Core Web Vitals.